Oil has had quite a year. Brent touched $118 in March, collapsed to $73 by the end of June, and closed July back at $90, holding near those levels into mid-August (as at 17 August 2026). Every time it moves, the same question lands on our desk: what does this mean for US bonds?
By: Nabeel Kolia, Portfolio Manager at Prescient Investment Management



The instinctive answer is the one we all learned first. Oil up, inflation up, yields up, so sell bonds. In the very short run that instinct is right. In thirty years of monthly data, oil moves and US Treasury yield moves are positively correlated, right across the curve.
But here is what the data tells us, and it is a story worth hearing: that first move is usually the wrong one to trade.
What the data actually shows
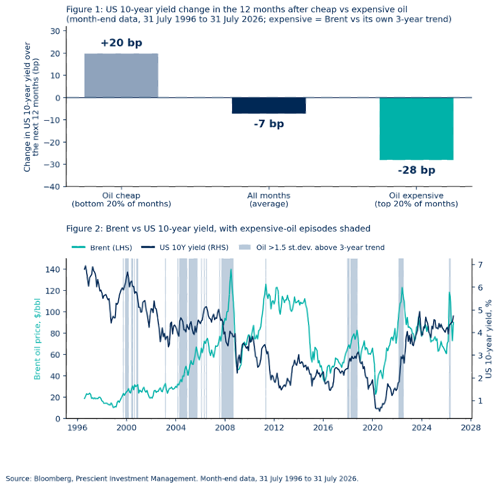
The oil price is not a new idea for us. It has long been one of the factors our systematic process tracks across the US bond complex, precisely because the evidence behind it is so persistent. And that evidence is simple enough to show in a single chart. Take thirty years of monthly data, measure how expensive Brent is relative to its own three-year trend each month, and then look at what yields did over the following twelve months.
The answer flips the instinct on its head. After the most expensive fifth of oil months, US 10-year yields fell by 28 basis points on average over the next year. After the cheapest fifth, they rose by 20. Same market, opposite outcomes, and in the opposite direction to what the inflation reflex suggests.
The extremes tell the same story. When oil traded more than 1.5 standard deviations above trend, 10-year yields were lower a year later 65% of the time. Oil itself averaged a 9% decline over the following year from those levels. Expensive oil, historically, has been a friend to duration, not an enemy.
Why?
Two mechanisms, and they reinforce each other.
The first is mean reversion. Oil spikes are usually driven by something temporary, such as a supply disruption or a geopolitical scare. High prices trigger their own cure: supply responds, demand adjusts, and the price falls back towards trend. Bond markets, however, often price the spike as if it were permanent, extrapolating a temporary shock into long-run inflation expectations. When oil normalises, that premium comes back out, and yields come down with it.
The second is that expensive oil is a tax. Every extra dollar spent at the pump is a dollar not spent elsewhere. Sustained high energy prices squeeze consumption and drag on growth. 2008 and 2011 are the textbook cases, and slower growth is precisely the environment in which long bonds perform.
So the very thing that makes oil spikes inflationary in the short run makes them disinflationary further out. The market's first reaction creates the entry point. The economics do the rest.
The honest caveat
February 2022 is the obvious counterexample. Oil spiked above $100 on the invasion of Ukraine, and anyone who bought duration on this logic had a brutal year, with 10-year yields rising more than 200 basis points.
The difference is that in 2022 the oil spike was not the end of an inflation story. It was the beginning of one, with a central bank still behind the curve. The signal works when an oil spike is squeezing an already stretched economy. It fails when oil is the opening act of a broad inflation impulse.
One more wrinkle: the effect is strongest at the long end of the curve and weakest at the front. Two-year yields are anchored to the Fed, which can respond to an oil shock by hiking. Ten- and twenty-year bonds price the whole journey, and that is where the mean reversion bites.
How we use it
This is also why oil has earned its place in our models as one factor among many, never as a trade rule. On its own it is a modest, persistent tilt: the kind of edge that compounds when combined with dozens of other signals, and the kind that would hurt you if you bet the book on it. We let the evidence set the size of our conviction, not the story.
Right now, that factor is telling an interesting tale. Its signal on US bonds peaked in late April with Brent near $118, faded as oil collapsed through June, and has strengthened again as crude recovered to $90, with the front end of the curve the least affected, exactly where thirty years of history says it should be.
So here is the reframe worth keeping. In the bond market, expensive oil has mostly marked the top of the inflation scare, not the start of it. That is the moment to be adding duration, not shedding it. If history is any guide, the time to worry about oil is when it is cheap.
Disclaimer:
Prescient Investment Management (Pty) Ltd is an authorised Financial Services Provider (FSP 612). Please note that there are risks involved in buying or selling a financial product, and past performance of a financial product is not necessarily a guide to future performance. The value of financial products can increase as well as decrease over time, depending on the value of the underlying securities and market conditions. There is no guarantee in respect of capital or returns in a portfolio. No action should be taken on the basis of this information without first seeking independent professional advice. For more information visit www.prescient.co.za